DPLUS083 - SOIL MAP & ONLINE DATABASE AS CLIMATE CHANGE MITIGATION TOOLS
MAPS
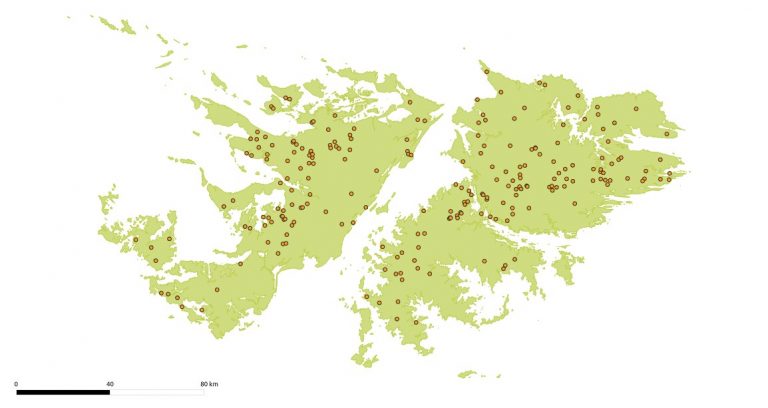
Soil Survey Points

A map of the Falkland Islands showing the locations of all planned soil survey points (dependent on landowner permission)
Preliminary Soil Maps
Preliminary soil maps were created to illustrate the type of final maps that will be delivered at the end of the project. These maps were based on 47 survey points only (Figure 1) and are therefore not statistically reliable. The soil samples were taken on improved and reseeded grassland and therefore may also give a distorted view of the Falkland Islands’ soil fertility. The maps are only presented to demonstrate what the project is developing. The data from these survey points were collected between 2012 and 2014 in the framework of the farm improvement program run by the Department of Agriculture (DoA). Below is a selection for potassium (Figure 2), aluminium (Figure 3), nitrogen (Figure 4) and erosion (Figure 5).
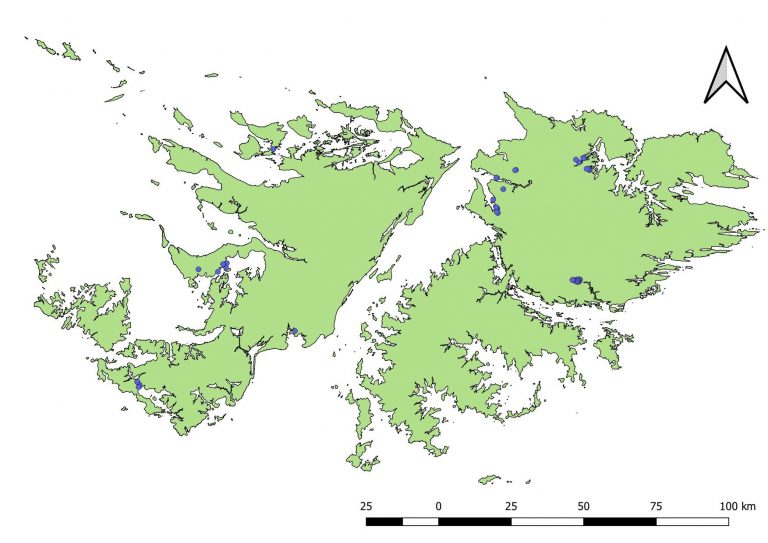
Figure 1: Map of the Falkland Islands showing the 47 survey points (blue dots) that were visited by the DoA between 2012 and 2014 and on which the following maps are based.
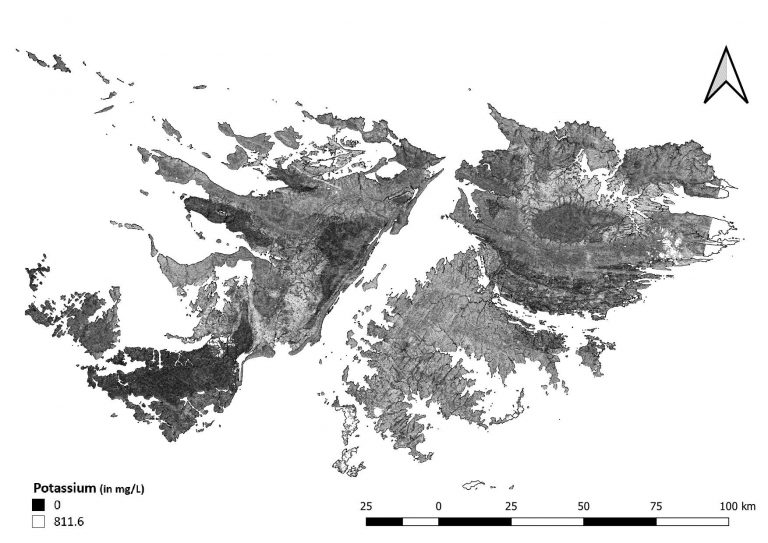
Figure 2: Map of the Falkland Islands showing levels of potassium in the soil. The paler the shade of grey the higher the level of potassium.
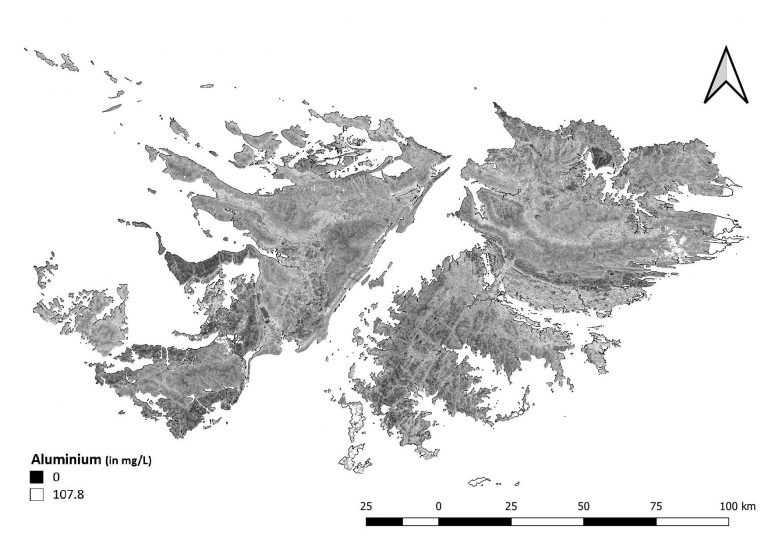
Figure 3: Map of the Falkland Islands showing levels of aluminium in the soil. The paler the shade of grey the higher the level of aluminium.
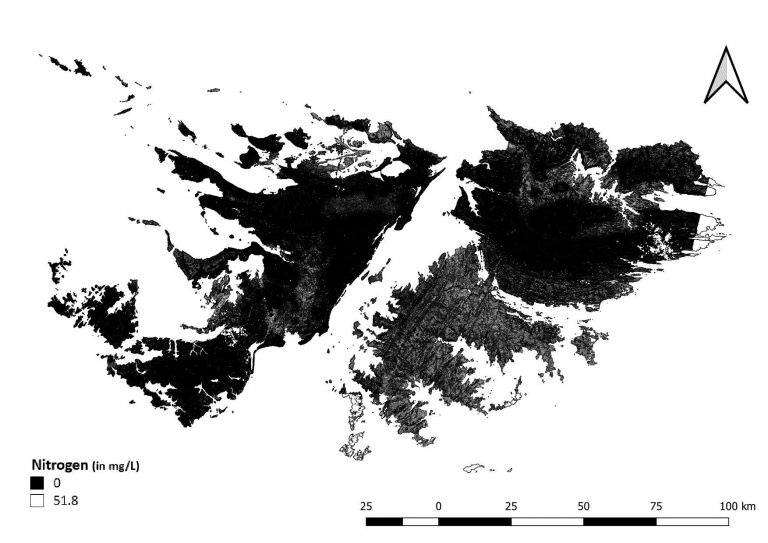
Figure 4: Map of the Falkland Islands showing levels of nitrogen in the soil. The paler the shade of grey the higher the level of nitrogen.
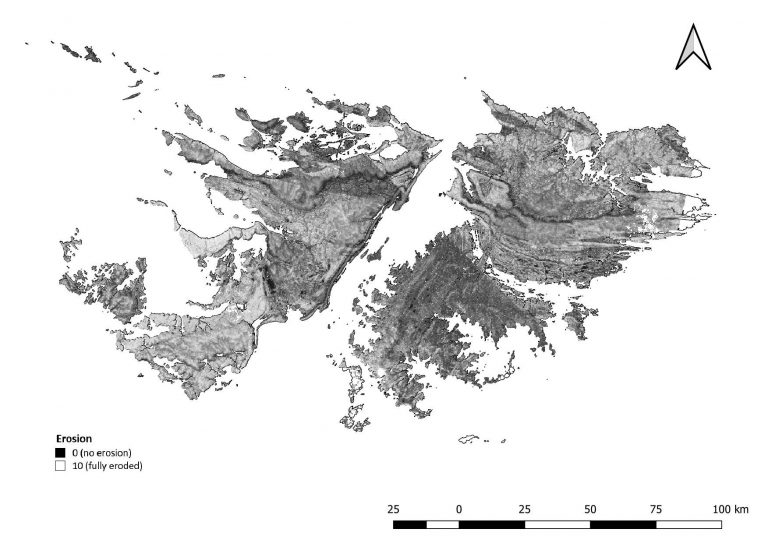
Figure 5: Erosion map of the Falkland Islands based on visual interpretation of satellite imagery. The paler the shade of grey, the higher the level of erosion. Erosion features will be recorded during the DarwinPLUS 083 soil surveys to create a more accurate map.